Environmental Data Silos in Water Monitoring in 2026
 Nick ThompsonPublished
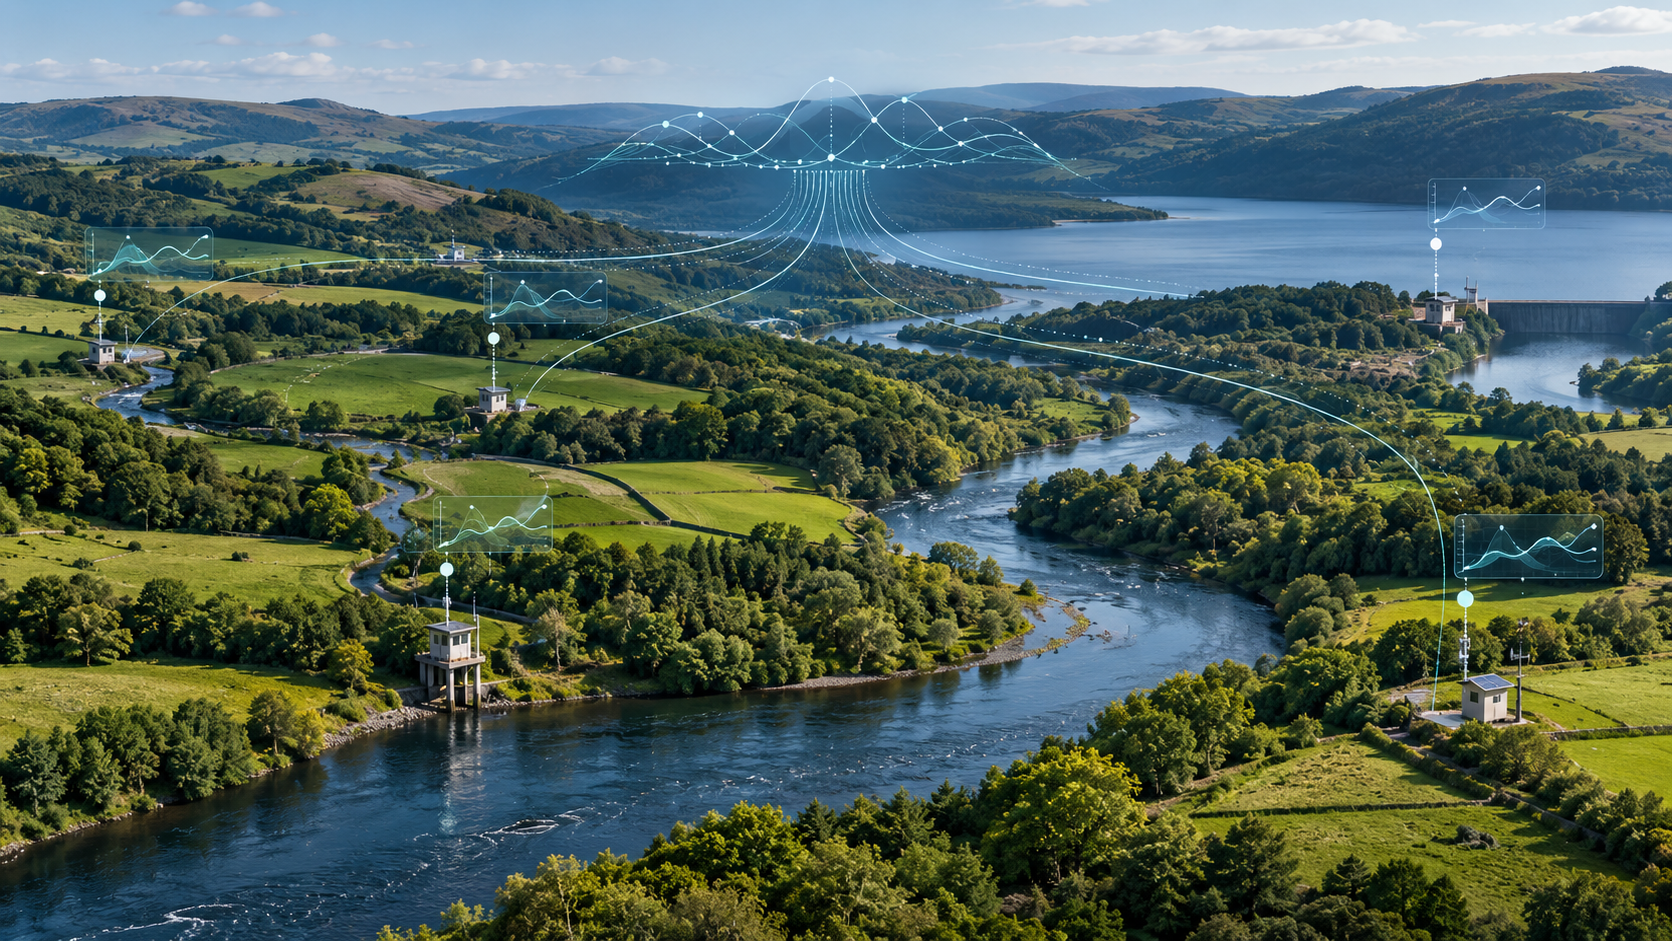
A river monitoring team may have live readings from several sites, laboratory results arriving by email, historic data in spreadsheets and compliance records in another system. Each source has a purpose. The difficulty comes when someone needs to understand what is happening across the whole catchment, quickly.
If the information does not join up, a rising nitrate reading at an abstraction point might be seen in one place while other water quality data sits elsewhere. Staff spend time finding and comparing records when they could be assessing the change and deciding what to do.
This is what people mean by a data silo: information that is available, but difficult to use alongside other relevant information. For water companies and environmental teams, the issue is often less about a lack of data than the effort needed to put it in context.
How do data silos develop?
Most monitoring networks have grown over time. New sensors are added to existing sites, different teams choose different systems, and older equipment remains in service because it still does its job. A typical programme might include:
- Field sensors reporting through more than one telemetry platform.
- Laboratory sample results held separately from live readings.
- Spreadsheets used to combine data for reports.
- Different naming conventions, units or timestamps across teams.
- Historic datasets stored in systems that are no longer used day to day.
None of these arrangements is necessarily a problem on its own. The problem appears when a team has to export files, reconcile formats or contact several colleagues to answer a straightforward question about a site.
For example, can someone easily see a turbidity increase upstream alongside dissolved oxygen and conductivity readings downstream? Can they retrieve the readings and supporting records for an incident without rebuilding the timeline by hand? If the answer takes several systems and a spreadsheet, the data is probably more fragmented than it needs to be.
Why does it matter?
Responding to changes in water quality
When readings are scattered across dashboards, it takes longer to establish whether an unusual result is a local sensor issue, a passing event or part of a wider change. Alerts help, but the team receiving an alert also needs the surrounding data to decide how to respond.
At a river abstraction point, for instance, timely nitrate readings can give operational teams a chance to review abstraction decisions as concentrations rise. That decision is more useful when the readings, alert history and related site information are easy to find together.
Reporting and compliance
Monitoring records need to be understandable and traceable. Pulling them together manually can introduce missing readings, mismatched timestamps and uncertainty about which version of a file was used. Connected systems can reduce that administrative work, although sound calibration, quality checks and clear ownership of the data remain essential.
For Section 82 monitoring, a consistent view of readings across sites can also make it easier to review events and prepare supporting information. The specific reporting approach still needs to match the organisation's regulatory requirements.
Seeing patterns across a catchment
A single site rarely tells the whole story. Comparing upstream and downstream locations can help teams investigate changes in nutrients, turbidity or dissolved oxygen. Looking across seasons may show patterns that are difficult to spot when historic records are split between platforms.
Connected data does not diagnose every event by itself. It gives people a better starting point for asking the right questions and deciding where further sampling or investigation is needed.
A quick way to spot the gaps
Choose one recent water quality event and try to reconstruct it from first alert to final report. Note where the team had to log into another system, request a file or change the format of a dataset. Then check whether the same site and parameter names, units and times were used throughout.
That exercise often reveals practical improvements without requiring a complete replacement of the monitoring network. It also helps identify the most valuable connections to make first.
Bringing the information together
There is no single fix for every organisation, but a few principles are useful:
- Map the data you already have. Include sensors, laboratory results, telemetry, historic files and reporting systems. Record who uses each source and how often it updates.
- Agree on consistent definitions. Site names, parameter labels, units, timestamps and quality flags need to mean the same thing wherever the data appears.
- Connect the most useful sources first. Prioritise readings that support time-sensitive decisions or create the most manual work in reporting.
- Put alerts in the hands of the right people. Define thresholds, recipients and the steps to take when an alert arrives. Review them as conditions and operational needs change.
- Check the result with a real task. Ask a colleague to compare sites or retrieve an incident timeline. If they still need multiple exports, the workflow needs more work.
Open APIs can help move monitoring data into existing systems. Sensor-agnostic monitoring can also make it easier to bring different equipment into a shared view. Neither removes the need for data quality controls or good working practices between field, laboratory and compliance teams.
Where WATR fits
WATR works with different sensor types and deployment options, including Bankside, Floating and Pumped Kiosk systems. WATR Pulse provides access to live and historic monitoring data across connected sites, with alerts to help teams respond when conditions change. WATR's API supports sharing data with other systems where integration is needed.
For catchment and reservoir teams, this can mean seeing readings from multiple locations in one place and getting earlier notice of a change at a key site. It can also make the monitoring record easier to review later, whether for an operational discussion, an investigation or reporting.
The goal is straightforward: make the data already being collected easier for people to use.
If you are reviewing how water quality data moves between your monitoring sites and operational systems, get in touch with WATR to discuss your network or arrange a WATR Pulse demonstration.
Frequently asked questions
What is a data silo in water monitoring?
It is a source of water quality information that is difficult to access or compare with other relevant data. Live sensor readings, laboratory results and compliance records may all describe the same site while remaining in separate systems.
Do we need to replace all our existing sensors?
Not necessarily. Start by checking what each device and platform can export or share, then identify the integrations that would make the biggest difference. Compatibility and data quality should be assessed for each source.
Will one dashboard solve the problem?
A shared dashboard can improve visibility, but the underlying data also needs consistent site names, units, timestamps and quality checks. Teams need a clear process for acting on alerts and maintaining the monitoring record.
What is a good first step?
Trace one real event or report through the current workflow. The manual handoffs usually show where connecting systems, improving data definitions or changing a process would save the most time.
Related posts
Get in touch
WATR has been designed to improve water quality around the world by providing an easy, accurate and a reliable way of monitoring water conditions, if you have any enquiries or questions please get in touch. Send us your specific requirements and we will get back to you as soon as possible.